
R-LandVision
Pick a plot — market and investment signals speak on the map
Real-estate analysis, portfolio and housing price index platform. Regional analysis, valuation and investment support.
How it works
Guided tour — explore the product now
Screen-by-screen walkthrough. No signup or demo booking — browse the real UI in a few minutes.
R-LandVision
Parcel to portfolio — 58 real product frames
Full cinema of every uploaded screen. Scroll the filmstrip, tap any frame, jump chapters — or open the guided tour and sample index reports.
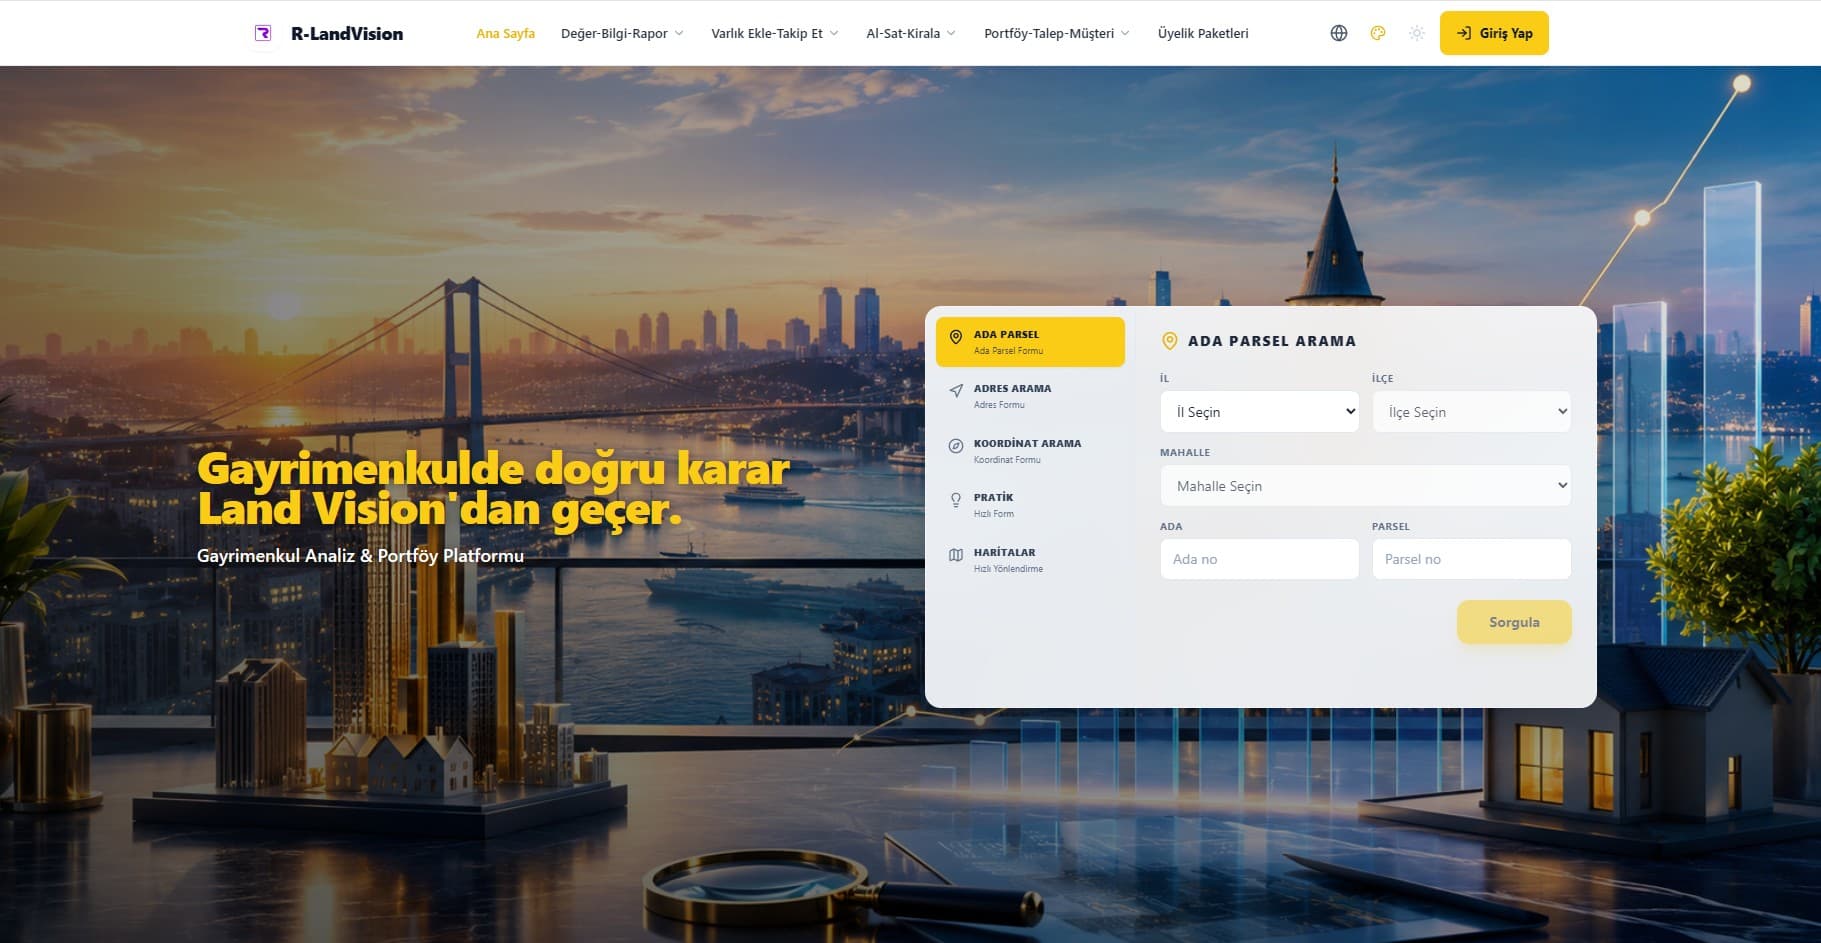
Gateway & search · 1 / 58
The right call starts on the map
Parcel, address or coordinates — one search card against the Istanbul skyline. LandVision opens here: analysis, portfolio and index through one gate. Visitors query before asking where to start.
58 frames
Filmstrip — scroll & jump
Showing 58 of 58 · tap a frame to open it in the cinema above
Sample outputs
Real-estate Index Report — Full | Summary
Two separate sample report types — Full and Summary are not the same PDF.
Real-estate Index Report — Full
Sample full index output. Market depth, district breakdown and full analysis pages — ready for the decision file. A separate report type from Summary.
Open PDF sample ↗Sample · SummaryReal-estate Index Report — Summary
Short sample in executive-summary form. Clarity for a 5-minute meeting — a separate output type from Full; not a trimmed twin of the same PDF.
Open PDF sample ↗Documents
Product catalogs
R-SMART platform PDFs (TR / EN) and Power CRM-AI HTML catalogs — open in a new tab and share.
Catalog
Real-estate Index Report — Full (sample)
Sample full index report. Detailed market / district breakdown — Full and Summary are separate output types.
Catalog
Real-estate Index Report — Summary (sample)
Sample summary index report. Short executive output — a separate sample from the Full report.
Outcomes
- Tie investment decisions to data
- Index and appraisal speak one language
- Portfolio visibility increases
Modules & capabilities
Every line is a capability. All run on the same platform.
Asset Management
Real-estate assets become a managed portfolio.
Regional Analysis
Shows the region’s pulse and micro-location differences.
Comparison Analysis
Puts alternatives side by side.
Where to Invest
Answers “where to invest?” with data.
Value Analyses
Makes market vs appraisal visible.
Permit Analyses
Permit reality becomes part of investment decisions.
Housing Price Index
₺/m² trends in index language.
Map Layers
Sale, rent, market and appraisal on one map.
Highlights
- Parcel / block / address search
- City–district–neighborhood depth
- Pro membership and report generation
- Find advisor & develop projects
FAQ
Who is LandVision for?
Built for real-estate investors, developers, advisors and asset managers.
How is the housing price index used?
You track ₺/m² trends by region and category with maps and reports.
Learn more
Real-estate analysis, portfolio and housing price index platform. Regional analysis, valuation and investment support.
Video
Bu modül için video yakında eklenecek. Şimdilik canlı demo talep edebilirsiniz.
Kurumsal ekiplerin güvendiği yönetim omurgası
Referanslar ve başarı hikayeleri için vaka çalışmalarını inceleyebilirsiniz.
Bir sonraki adımı birlikte netleştirelim
Önce ihtiyacınızı anlayalım; sonra doğru modül ve yol haritasını birlikte kuralım.
R-LandVision demo
30-minute live demo. Real product. Setup starts within 24 hours after approval.
- 24-hour setup — After approval we stand up your cloud environment within 24 hours
- Native mobile — Access from the field with iOS and Android apps
- Live demo — Real product in 30 minutes, scenario tailored to your org